Moog, Inc. - Class B Shares Close the Day 39.9% Lower - Daily Wrap
The company saw its shares close the day 39.9% lower than yesterday, with trading volume lower than its 30 day average.
Jan 31, 2024 by Kwhen Finance Editors
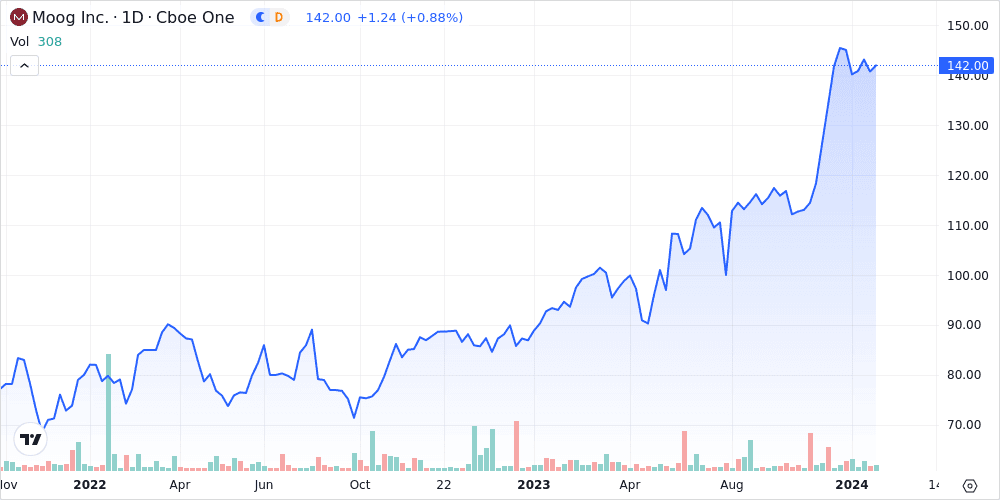
Moog, Inc. - Class B (MOG.B) shares closed today 39.9% lower than it did at the end of yesterday. The stock is currently down 3.0% year-to-date, up 51.1% over the past 12 months, and up 83.3% over the past five years. Today, the Dow Jones Industrial Average fell 0.8%, and the S&P 500 fell 1.6%.
Trading Activity
- Shares traded as high as $143.19 and as low as $139.40 this week.
- Shares closed 41.8% below its 52-week high and 6.1% below its 52-week low.
- Trading volume this week was 37.9% lower than the 10-day average and 40.6% lower than the 30-day average.
- Beta, a measure of the stock’s volatility relative to the overall market stands at 0.0.
Technical Indicators
- The Relative Strength Index (RSI) on the stock was under 30, indicating it may be underbought.
- MACD, a trend-following momentum indicator, indicates a downward trend.
- The stock closed above its Bollinger band, indicating it may be overbought.
Market Comparative Performance
- The company's share price lags the S&P 500 Index today, beats it on a 1-year basis, and lags it on a 5-year basis
- The company's share price lags the Dow Jones Industrial Average today, beats it on a 1-year basis, and beats it on a 5-year basis
- The company share price lags the performance of its peers in the Information Technology industry sector today, lags it on a 1-year basis, and lags it on a 5 year basis
| Name | DoD %Δ | YTD %Δ | 1 Yr % | 52-Week H % | 52-Week L % |
|---|---|---|---|---|---|
| Moog, Inc. - Class B | -39.9 | -3.0 | 51.1 | -2.4 | 57.6 |
| Dow Jones Industrial Average | -0.8 | 1.8 | 15.9 | 0.5 | 25.4 |
| S&P 500 Index | -1.6 | 3.4 | 23.8 | -0.6 | 31.3 |
| Information Technology | -2.6 | 6.6 | 58.2 | -3.2 | 58.1 |
Peer Group Comparative Performance
- The company's stock price performance year-to-date lags the peer average by -335.3%
- The company's stock price performance over the past 12 months beats the peer average by 185.0%
- The company's price-to-earnings ratio, which relates a company's share price to its earnings per share, is 9.2% higher than the average peer.
| Name | MKT CAP (USD) | P/E | YTD %Δ | 1 Yr %Δ | 52-Week H % | 52-Week L % |
|---|---|---|---|---|---|---|
| Moog, Inc. - Class B | MOG.B | 26.8 | -3.0 | 51.1 | -2.4 | 57.6 |
| Peer Avg | N/A | 24.5 | 1.3 | 17.9 | -1.9 | 21.6 |
| Abbott Laboratories | ABT | 38.2 | 3.6 | 5.3 | -1.4 | 27.7 |
| Honeywell International Inc | HON | 24.7 | -3.2 | 0.8 | ||
| General Dynamics Corp. | GD | 21.9 | 2.5 | 19.1 | 0.4 | 35.3 |
| Transdigm Group Incorporated | TDG | 47.7 | 6.9 | 57.8 | -0.2 | 64.3 |
| Curtiss-Wright Corp. | CW | 25.2 | 1.5 | 41.6 | -0.7 | 43.8 |
| Woodward Inc | WWD | 36.9 | 4.8 | 30.4 | ||
| Ducommun Inc. | DCO | 38.3 | -4.9 | -11.9 | -14.8 | 23.5 |
| Astronics Corp. | ATRO | -12.1 | 0.1 | 18.0 | ||
This story was produced by the Kwhen Automated News Generator. For more articles like this, please visit us at finance.kwhen.com. Write to editors@kwhen.com. © 2021 Kwhen Inc.
Was this content valuable for you?
Tags: